Why Analytics & Reporting Are Essential for Modern Business Success
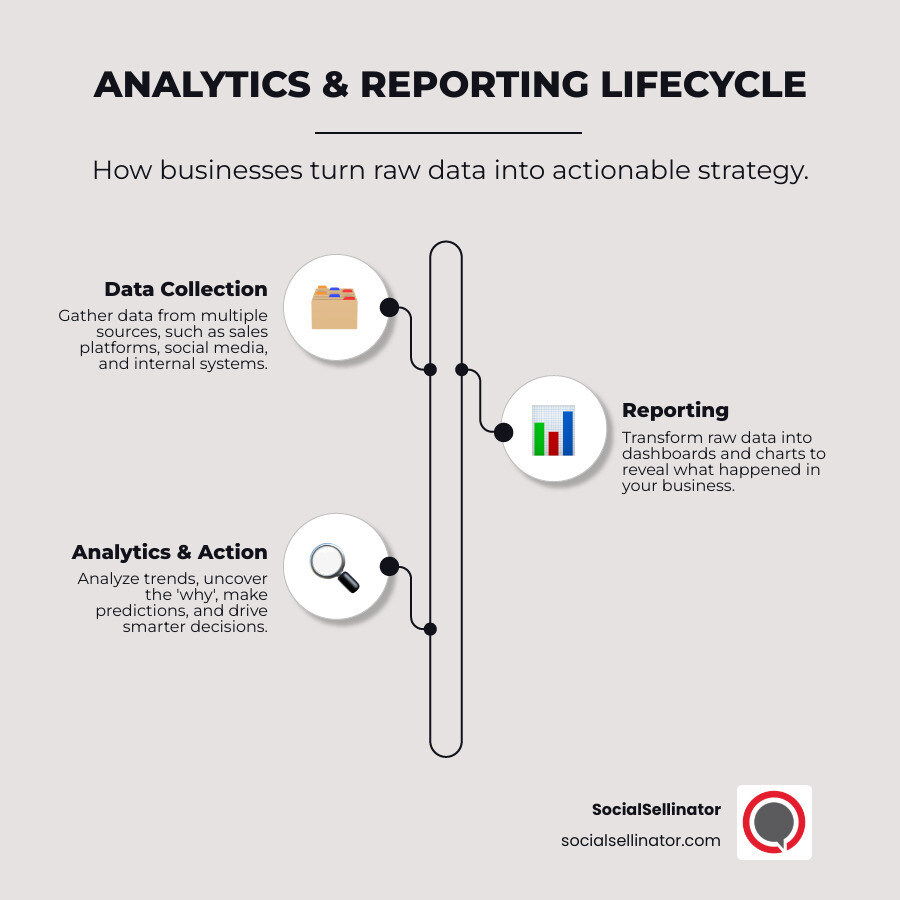
Analytics & Reporting are two distinct but complementary approaches to understanding your business data. While reporting tells you what happened by presenting historical data in structured formats like dashboards and charts, analytics goes deeper to explain why it happened and what you should do next using advanced techniques like predictive modeling and statistical analysis.
Quick Answer: The Key Differences
| Reporting | Analytics |
|---|---|
| Purpose: What happened? | Purpose: Why did it happen? What's next? |
| Output: Dashboards, tables, charts | Output: Insights, predictions, recommendations |
| Frequency: Regular, scheduled | Frequency: Ad-hoc, continuous exploration |
| Skills: Basic data formatting | Skills: Statistical modeling, advanced analysis |
| Goal: Monitor performance | Goal: Drive strategic decisions |
Here's the reality: 77,800+ business leaders already subscribe to data-focused newsletters because they understand that companies using both reporting and analytics make faster, smarter decisions. Yet many organizations still struggle with turning their mountains of data into actionable insights.
Think of it this way – reporting is like a nurse taking your vital signs and recording them on a chart. Analytics is like the doctor who looks at those vital signs, diagnoses what's wrong, and prescribes the right treatment. You need both to stay healthy.
The stakes are high. Companies that master this combination see dramatic results: 85% decreases in cost per acquisition and 18× improvements in conversion rates. But those who rely only on basic reporting often find themselves drowning in data without understanding what it means for their business.
Whether you're a marketing director frustrated by low-quality leads or a business owner who needs to prove ROI on every dollar spent, understanding the difference between analytics and reporting isn't just helpful – it's essential for survival in today's data-driven marketplace.
What You'll Learn
By the end of this guide, you'll understand exactly when to use reporting versus analytics, how to build an effective data stack, and which tools will give you the biggest bang for your buck. We'll walk you through real-world examples, from e-commerce companies that cut their cost per acquisition by 85% to nonprofits that reduced reporting time by 50%.
Most importantly, you'll learn how to move beyond just collecting data to actually using it for strategic advantage. Whether you're just starting with basic reports or ready to implement predictive analytics, this guide will show you the path forward.
Analytics & Reporting 101: Definitions, Differences, and Why Both Matter
Let's start with the fundamentals. Analytics & Reporting work together like a well-oiled machine, but they serve very different purposes in your business intelligence strategy.
Reporting is your business's memory system. It collects data from various sources and organizes it into structured formats like dashboards, charts, and tables. When you look at your monthly sales report or check your website traffic dashboard, you're consuming reporting. It answers the critical question: "What happened?"
Analytics, on the other hand, is your business's brain. It takes that organized data and applies statistical methods, machine learning, and advanced modeling to uncover patterns, predict outcomes, and recommend actions. Analytics answers the strategic questions: "Why did this happen?" and "What should we do next?"
According to research from Harvard Business Review, companies that effectively combine both approaches are significantly more likely to make data-driven decisions that drive competitive advantage.
Primary Goals of Reporting
Reporting serves three essential functions in any organization:
Compliance and Transparency: Many industries require regular reporting for regulatory compliance. Financial reports, safety metrics, and performance summaries keep stakeholders informed and ensure legal requirements are met.
Routine Monitoring: Reports provide a consistent way to track key performance indicators (KPIs) over time. Your weekly sales report, monthly marketing dashboard, or quarterly financial summary all serve this monitoring function.
Single Source of Truth: Good reporting creates a unified view of your business metrics, eliminating the confusion that comes from different departments using different numbers. When everyone looks at the same dashboard, everyone speaks the same language.
Primary Goals of Analytics & Reporting in Tandem
When reporting and analytics work together, they open up powerful capabilities:
Root Cause Analysis: While reports show you that sales dropped 15% last quarter, analytics digs deeper to find it was due to a specific customer segment churning after a product change. This combination of "what" and "why" enables targeted solutions.
Forecasting and Prediction: Reports show historical trends, but analytics uses that data to predict future outcomes. A retail company might use sales reports to feed predictive models that forecast inventory needs for the next quarter.
Continuous Optimization: The reporting-analytics cycle creates a feedback loop for improvement. Reports identify opportunities, analytics provides insights, actions are taken, and new reports measure the results.
Benefits & Limitations
Reporting Benefits:
- Speed: Automated reports deliver consistent updates without manual intervention
- Accessibility: Visual dashboards make data digestible for non-technical stakeholders
- Standardization: Consistent formats ensure everyone interprets data the same way
Reporting Limitations:
- Static: Reports show what happened but not why or what to do about it
- Reactive: You only learn about problems after they've already occurred
- Surface-level: Complex business questions require deeper analysis
Analytics Benefits:
- Proactive: Predictive models can identify issues before they become problems
- Strategic: Advanced analysis reveals opportunities that aren't obvious from reports alone
- Actionable: Analytics provides specific recommendations, not just observations
Analytics Limitations:
- Complexity: Requires specialized skills and tools
- Time-intensive: Deep analysis takes longer than generating standard reports
- Resource-heavy: Advanced analytics requires significant computational power and expertise
The Four Pillars: Types, Processes, and Use Cases
Understanding the four types of analytics helps you choose the right approach for different business questions. Think of these as building blocks that work together to create a complete picture of your business.
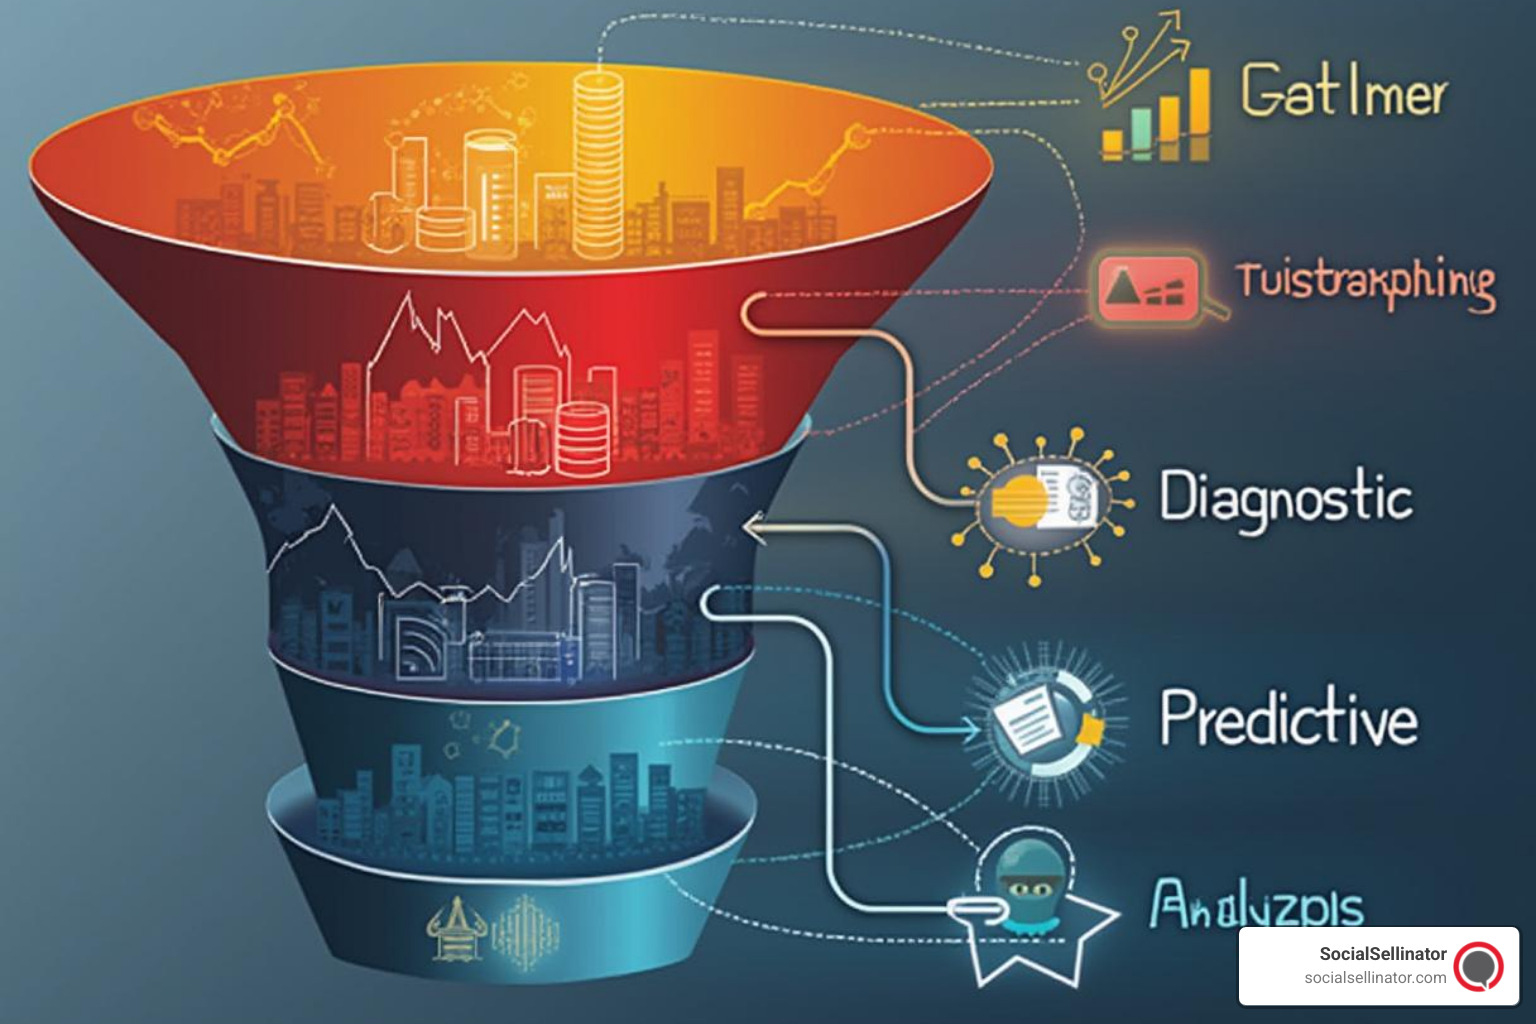
Descriptive Analytics answers "What happened?" This is the foundation layer that includes most traditional reporting. Your Google Analytics dashboard showing website traffic, your sales reports, and your social media metrics all fall into this category. It's about summarizing historical data into meaningful formats.
Diagnostic Analytics answers "Why did it happen?" This is where basic analytics begins. When you see a spike in website traffic and drill down to find it came from a viral social media post, you're doing diagnostic analytics. It involves comparing data across different dimensions and time periods to identify patterns and correlations.
Predictive Analytics answers "What will happen?" This uses statistical models and machine learning to forecast future outcomes. An e-commerce company might use predictive analytics to identify customers likely to churn, or a retailer might predict which products will be popular next season based on historical trends and external factors.
Prescriptive Analytics answers "What should we do?" This is the most advanced level, using optimization algorithms and decision modeling to recommend specific actions. A logistics company might use prescriptive analytics to optimize delivery routes, considering factors like traffic patterns, fuel costs, and customer priorities.
For more insights on leveraging analytics in your digital marketing strategy, check out our guide on Digital Marketing Analytics Tools.
Reporting Workflow Step-by-Step
The reporting process follows a predictable pattern that can be automated and standardized:
Step 1: Data Collection - Gather data from various sources including CRM systems, website analytics, social media platforms, and operational databases. Modern businesses typically pull from 10-15 different data sources.
Step 2: Extract, Transform, Load (ETL) - Raw data rarely comes in a format ready for reporting. The ETL process cleans the data, standardizes formats, and loads it into a central repository or data warehouse.
Step 3: Visualization - Transform processed data into charts, graphs, tables, and dashboards. The key is choosing the right visualization type for your audience and message.
Step 4: Distribution - Deliver reports to stakeholders through automated emails, shared dashboards, or embedded widgets. Most organizations schedule reports daily, weekly, or monthly depending on the metric's importance.
Analytics Workflow Step-by-Step
Analytics follows a more exploratory and iterative process:
Step 1: Hypothesis Formation - Start with a specific business question or problem. For example, "Why are customers churning after their first purchase?" or "Which marketing channels drive the highest lifetime value?"
Step 2: Model Building - Select appropriate analytical techniques and build models to test your hypothesis. This might involve regression analysis, clustering, time series forecasting, or machine learning algorithms.
Step 3: Validation - Test your model's accuracy using historical data or controlled experiments. A good model should consistently predict outcomes with measurable accuracy.
Step 4: Action - Implement recommendations based on your analysis. This might mean adjusting marketing spend, changing product features, or modifying operational processes.
Real-World Scenarios
Let's look at how leading companies combine reporting and analytics to drive results:
E-commerce CPA Success Story: Lider, an online retailer, used Google Analytics as their single source of truth across website and mobile app. By combining standard traffic reports with advanced analytics to identify high-value user segments, they achieved an 85% decrease in cost per acquisition and 18x improvement in conversion rates. The reporting showed them which channels were performing, while analytics revealed which specific user behaviors predicted purchases.
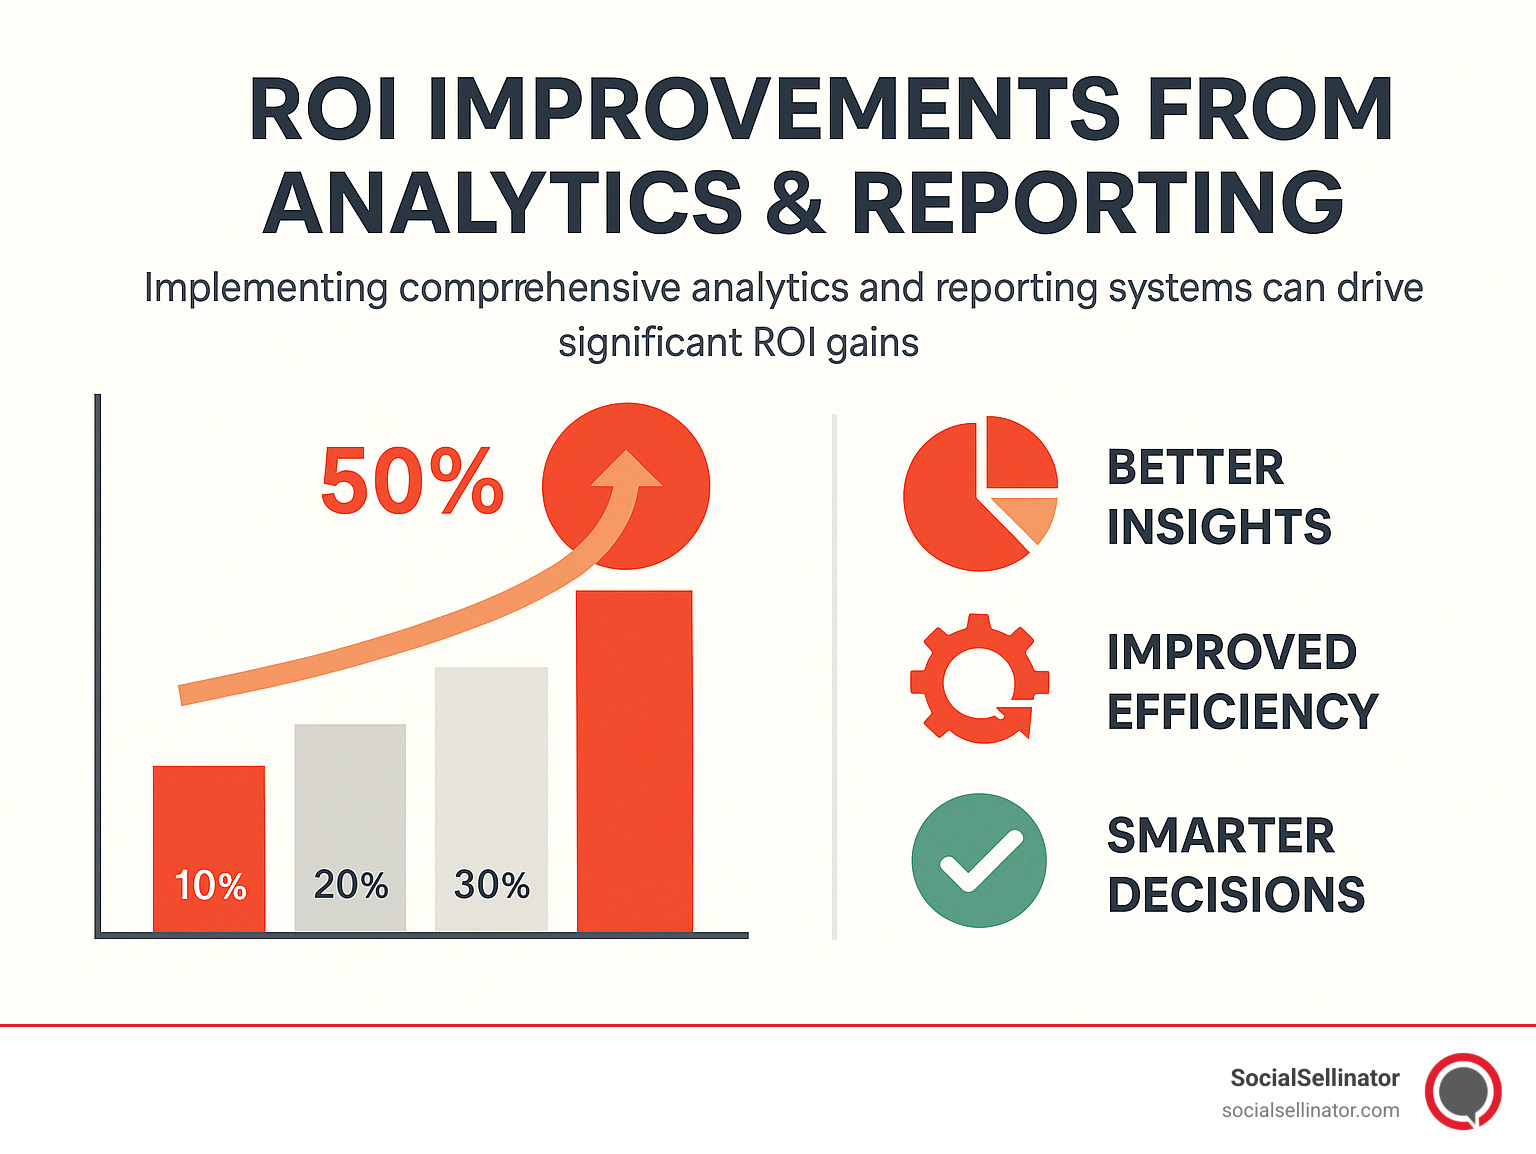
Nonprofit Efficiency Breakthrough: 412 Food Rescue used Google Analytics to understand their complete user journey across platforms. By combining reporting on volunteer engagement with predictive analytics to identify the most effective recruitment channels, they cut their reporting time by 50% while optimizing their volunteer acquisition strategy.
Supply Chain Optimization: A logistics company used descriptive reporting to track delivery performance, diagnostic analytics to identify bottlenecks, and prescriptive analytics to optimize routes. The result was a 15% reduction in fuel costs and 20% improvement in on-time deliveries.
According to McKinsey's research on data-driven organizations, companies that successfully integrate analytics and reporting are 23 times more likely to acquire customers and 19 times more likely to be profitable.
Building Your Data Stack: Tools, Technologies, and Selection Criteria
Choosing the right tools for Analytics & Reporting can make or break your data strategy. The good news is that you don't need to spend a fortune to get started - many powerful tools are available at reasonable costs or even free.
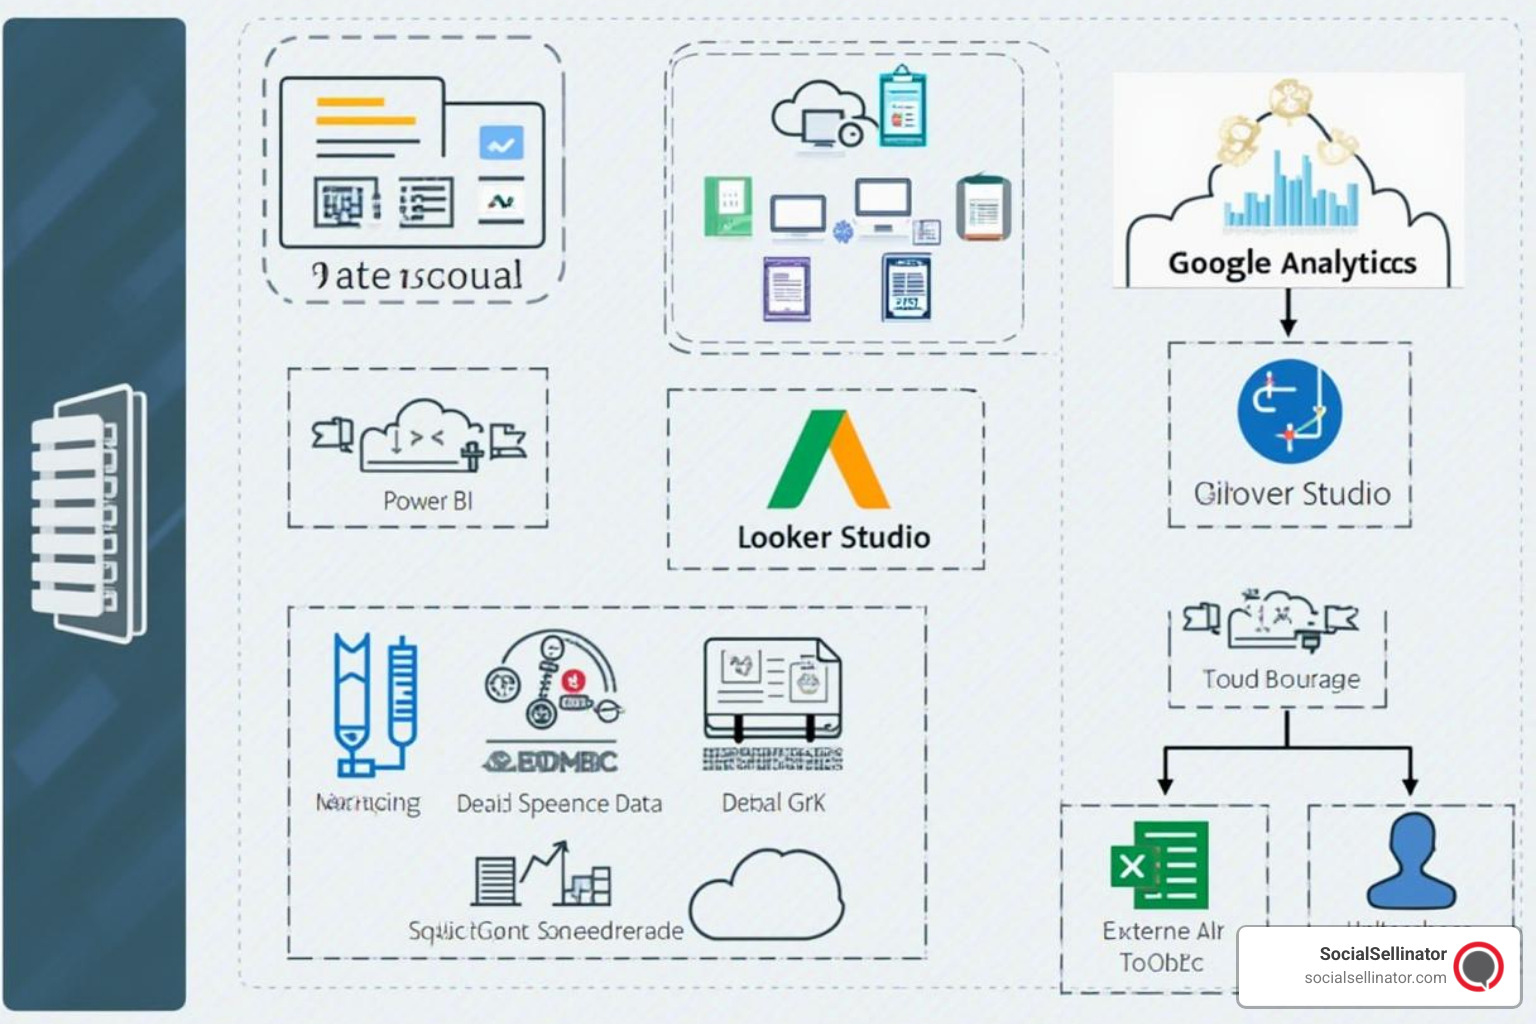
Power BI stands out as a comprehensive solution that can connect to hundreds of data sources, providing a centralized place to create reports for data spread throughout your domain. It's particularly strong for organizations already using Microsoft products, offering seamless integration with Excel, SharePoint, and Azure services.
Google Analytics 4 has become the gold standard for web analytics, offering cross-platform tracking and AI-powered insights. The recent shift from Universal Analytics to GA4 brings event-based tracking that provides more granular insights into user behavior across web and mobile platforms.
Looker Studio (formerly Google Data Studio) offers powerful data visualization capabilities with native connections to Google's ecosystem. It's particularly valuable for organizations heavily invested in Google Workspace and Google Cloud platforms.
Databox specializes in automated reporting and dashboard creation, offering over 100 integrations and 500+ dashboard templates. It's designed to streamline the reporting process and can generate comprehensive reports in seconds rather than hours.
Jupyter Notebooks provide a flexible environment for advanced analytics, supporting multiple programming languages including Python, R, and Scala. They're ideal for data scientists who need to perform complex analysis and share their methodology with others.
For businesses focused on social media performance, our guide on Top 7 Social Media Analytics Tools in 2025 provides detailed comparisons of specialized platforms.
According to Gartner's research on business intelligence adoption, organizations that successfully implement BI tools see an average ROI of 13:1 within the first year.
Key Selection Criteria
When evaluating tools for your Analytics & Reporting stack, consider these critical factors:
Data Source Connectivity: Can the tool connect to all your important data sources? Modern businesses typically use 10-15 different platforms, from CRM systems to social media accounts. Look for tools that offer native connectors or robust APIs.
User Skill Requirements: Match tools to your team's capabilities. Power BI and Looker Studio work well for business users, while Jupyter Notebooks require programming skills. Consider the learning curve and available training resources.
Cost Structure: Understand both upfront and ongoing costs. Some tools charge per user, others per data source or storage volume. Factor in implementation costs, training expenses, and potential consulting fees.
Security and Governance: Ensure tools meet your organization's security requirements, especially if handling sensitive customer data. Look for features like role-based access control, data encryption, and audit trails.
Scalability: Choose tools that can grow with your business. A solution that works for 10 users and 3 data sources might not scale to 100 users and 30 data sources.
Matching Tools to Maturity Levels
Starter Level: If you're just beginning your analytics journey, start with Google Analytics for web data and either Power BI or Looker Studio for basic dashboards. These tools provide immediate value without requiring significant technical expertise.
Intermediate Level: As your needs grow, consider adding specialized tools like Databox for automated reporting or Semrush for competitive analysis. This is also when you might start exploring predictive analytics with tools like Google Analytics' built-in machine learning features.
Advanced Level: Mature organizations often implement comprehensive platforms like Tableau or build custom solutions using tools like Jupyter Notebooks connected to cloud data warehouses. This level typically requires dedicated data science resources.
Analytics & Reporting Best Practices and Success Stories
The difference between companies that succeed with data and those that struggle often comes down to following proven best practices. Let's explore the strategies that separate the winners from the also-rans.
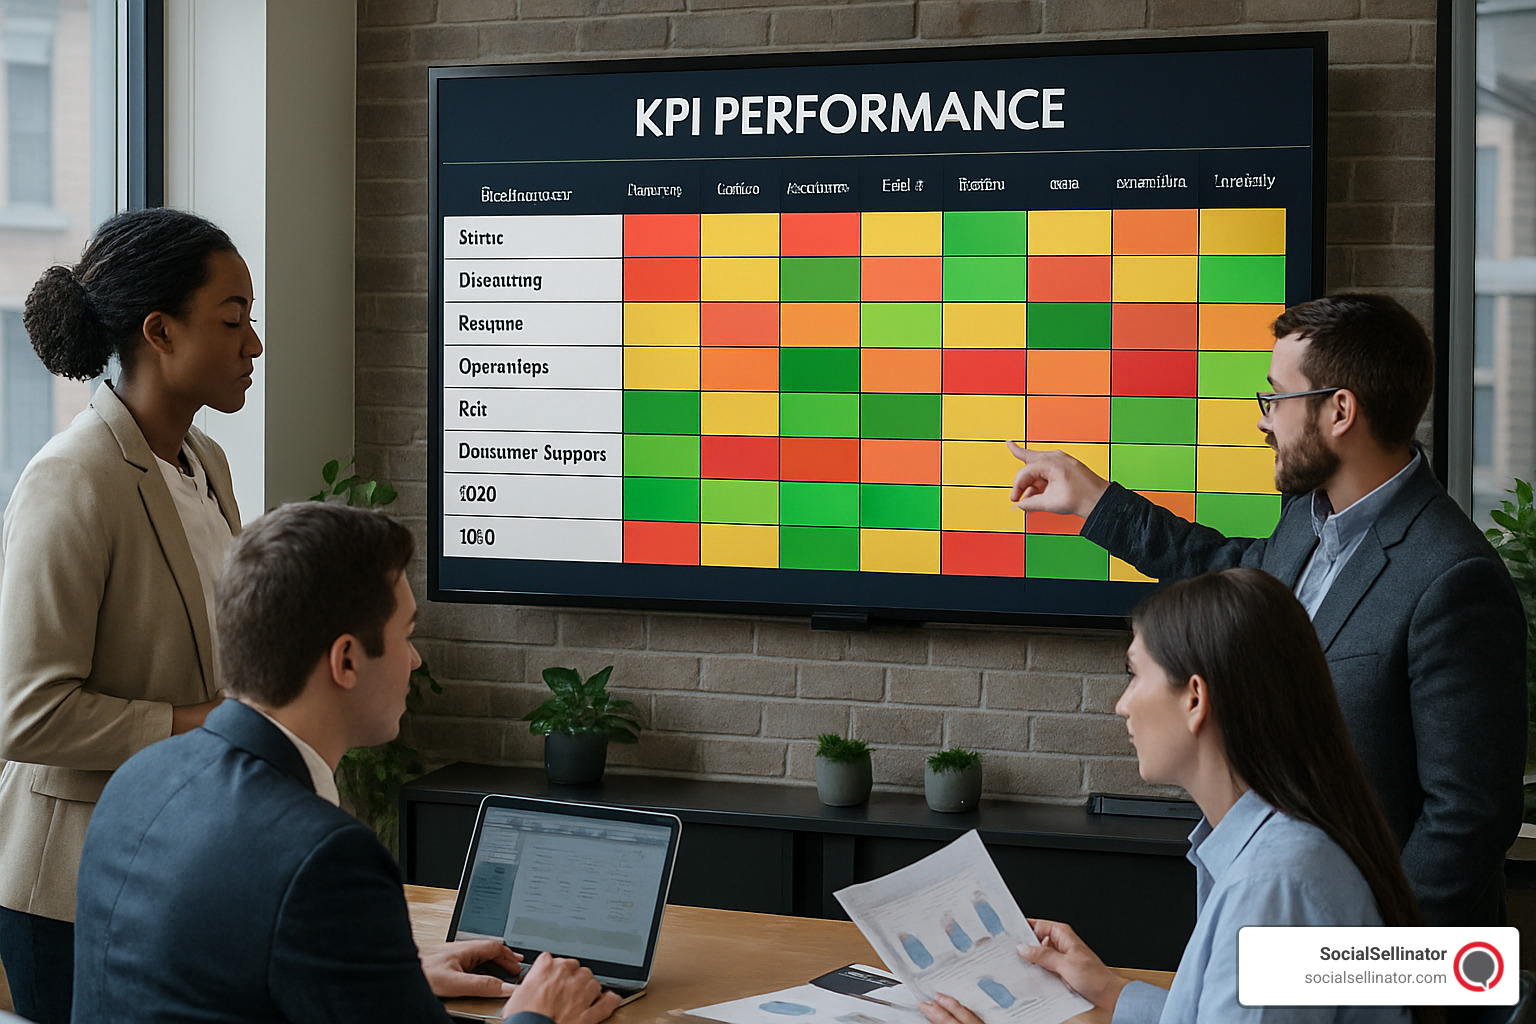
Data Quality is Non-Negotiable: The most sophisticated analytics in the world won't help if your data is inaccurate. Implement validation rules, regular audits, and clear data governance policies. One e-commerce company found that 15% of their customer data contained errors, leading to misdirected marketing campaigns and lost revenue.
Start with Business Questions, Not Tools: Too many organizations buy expensive analytics tools and then wonder what to do with them. Instead, start with specific business questions: "Why are customers churning?" or "Which marketing channels drive the highest lifetime value?" Then choose tools that help answer those questions.
Automate Everything You Can: Manual reporting is a productivity killer. Databox users report saving up to 5 hours per week by automating their reporting processes. Set up automated dashboards, scheduled reports, and alert systems to free up time for actual analysis.
Tell Stories, Don't Just Show Numbers: Research shows that people remember stories 22 times more than facts alone. When presenting analytics results, frame them as narratives: "Here's what happened, why it happened, and what we should do about it."
Designing Effective Dashboards
Great dashboards follow the "5-second rule" - users should understand the key message within 5 seconds of looking at the screen.
Accept Minimalism: Include only the most important metrics on each dashboard. A cluttered dashboard is a useless dashboard. Most effective dashboards show 5-7 key metrics, not 25-30.
Use Color Strategically: Red for problems, green for success, yellow for caution. But don't rely on color alone - use icons, shapes, and text to ensure accessibility for colorblind users.
Design for Mobile: With more executives checking dashboards on their phones, ensure your visualizations work on small screens. This often means simplifying charts and using larger fonts.
Context is King: A 20% increase sounds great, but compared to what? Always provide context through comparisons to previous periods, benchmarks, or goals.
Ensuring Data Accuracy & Trust
Implement Version Control: Keep track of changes to reports and dashboards. When numbers change, stakeholders need to understand why. Document data sources, calculation methods, and any assumptions made.
Create Data Dictionaries: Ensure everyone understands what metrics mean. "Conversion rate" might mean different things to different departments. Clear definitions prevent confusion and build trust.
Regular Audits: Schedule monthly or quarterly reviews of your data sources and calculations. Automated systems can fail, integrations can break, and business rules can change.
Transparent Limitations: Be upfront about what your data can and cannot tell you. If your analytics exclude certain customer segments or time periods, make that clear in your reports.
Moving From Reports to Advanced Analytics & Reporting
Develop a Capability Roadmap: Plan your analytics evolution in stages. Start with basic reporting, add diagnostic capabilities, then move to predictive and prescriptive analytics. Each stage builds on the previous one.
Invest in Skills Development: Advanced analytics requires new skills. Consider training existing staff, hiring specialists, or partnering with agencies that have deep analytics expertise.
Build Cross-Functional Teams: The most successful analytics initiatives involve collaboration between IT, marketing, operations, and executive leadership. Break down silos to ensure insights actually drive action.
For businesses looking to measure social media ROI effectively, our guide on Calculating ROI for Social Media provides detailed frameworks and examples.
Frequently Asked Questions about Analytics & Reporting
What's the quickest way to upgrade from basic reports to predictive analytics?
The fastest path is to start with tools that have built-in machine learning capabilities. Google Analytics 4, for example, includes predictive metrics like "purchase probability" and "churn probability" without requiring any technical setup. Power BI offers similar capabilities through its AI features.
Begin by identifying one specific business question where prediction would be valuable - like "Which customers are likely to cancel their subscription?" Then use these built-in features to generate initial predictions. As you gain confidence and see results, you can invest in more sophisticated tools and techniques.
Which roles should own reporting versus analytics in my organization?
Based on survey data showing that most companies have 2-3 data analysts and separate reporting analysts, here's the typical division:
Reporting Analysts focus on data collection, cleaning, and presentation. They ensure reports are accurate, timely, and accessible. These roles typically require strong Excel skills and familiarity with BI tools but don't need advanced statistical knowledge.
Data Analysts perform deeper investigation, hypothesis testing, and predictive modeling. They need statistical skills, programming knowledge (Python, R, or SQL), and business acumen to translate insights into recommendations.
Business Intelligence Managers oversee the entire data strategy, ensuring that both reporting and analytics align with business objectives and that insights actually drive decisions.
How do reporting and analytics support decision-making at executive vs team levels?
Executive Level: C-suite leaders need high-level dashboards that show key performance indicators and trend analysis. They're less interested in detailed breakdowns and more focused on strategic implications. Executive reports should answer questions like "Are we on track to meet our quarterly goals?" and "What are the biggest opportunities and threats?"
Department Level: Marketing directors, sales managers, and operations leaders need more detailed analytics that help them optimize their specific areas. They want to understand which campaigns are working, which sales tactics are most effective, and where operational bottlenecks occur.
Team Level: Individual contributors need granular data that helps them improve their daily work. A content creator might need to know which blog posts drive the most engagement, while a sales rep might need to understand which prospects are most likely to convert.
The key is tailoring both the level of detail and the presentation format to each audience's needs and decision-making authority.
Conclusion
Analytics & Reporting aren't just nice-to-have features in today's business environment - they're essential tools for survival and growth. The companies that master both approaches don't just make better decisions; they make them faster and with greater confidence.
We've seen how reporting provides the foundation by answering "what happened," while analytics builds on that foundation to explain "why it happened" and "what to do next." The most successful organizations don't choose between reporting and analytics - they use both strategically, matching the right approach to each business question.
The key takeaways for your organization:
- Start with clear business questions before selecting tools or techniques
- Invest in data quality - even the most sophisticated analytics won't help if your data is wrong
- Automate routine reporting to free up time for strategic analysis
- Build capabilities gradually - you don't need to implement everything at once
- Focus on actionable insights rather than just interesting observations
The goal isn't to have the most advanced analytics or the prettiest dashboards. The goal is to make better business decisions that drive growth, reduce costs, and improve customer satisfaction.
Whether you're just starting with basic Google Analytics or ready to implement machine learning models, the path forward is clear: combine solid reporting foundations with strategic analytics capabilities, and always keep your focus on driving real business value.
At SocialSellinator, we help businesses steer this journey from basic reporting to advanced analytics. Our team understands that every organization is at a different stage of data maturity, and we tailor our approach to meet you where you are while building toward where you want to be.
Ready to transform your data into actionable insights? Let's start with a conversation about your current challenges and goals. Learn more about our services and find how we can help you build a data strategy that drives real results.
Headquartered in San Jose, in the heart of Silicon Valley and the San Francisco Bay Area, SocialSellinator proudly provides top-tier digital marketing, SEO, PPC, social media management, and content creation services to B2B and B2C SMB companies. While serving businesses across the U.S., SocialSellinator specializes in supporting clients in key cities, including Austin, Boston, Charlotte, Chicago, Dallas, Denver, Kansas City, Los Angeles, New York, Portland, San Diego, San Francisco, and Washington, D.C.


